一、性能统计知识
- 系统级性能数据分析
- 进程级别性能数据分析
1.2、常用性能指标
- CPU算法代表的高效性
- mem代表数据结构使用的合理性
- net io
二、统计方法
- 临时性分析 命令交互
- 系统性分析 Prometheus grafana
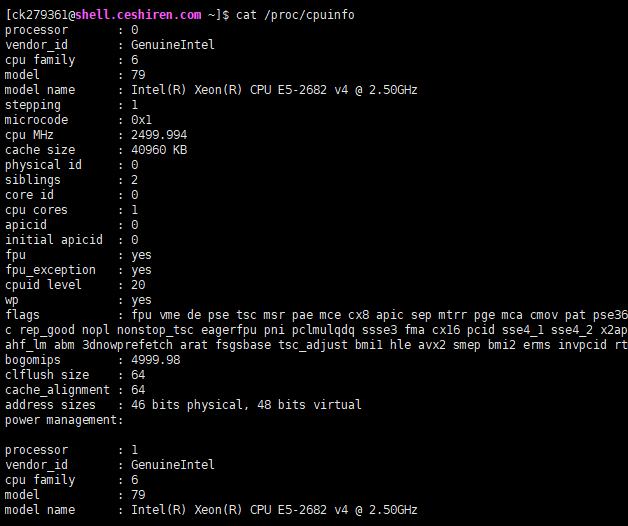
三、CPU使用统计
- cat /proc/cpuinfo
系统负载与进程CPU占用TOP
- top
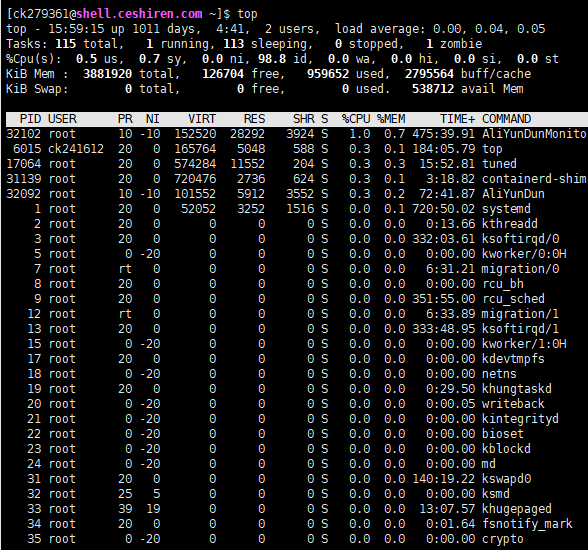
top -hv|-bcHiOSs -d secs -n max -u|U user -p pid -o fld -w [cols]
CPU关键性指标
- CPU利用率 进程的CPU利用情况
- load average 系统负载情况
ps命令的CPU是平均CPU利用率,不适合做性能分析
四、内存(MEM)占用统计
常用命令
- free
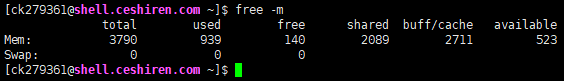
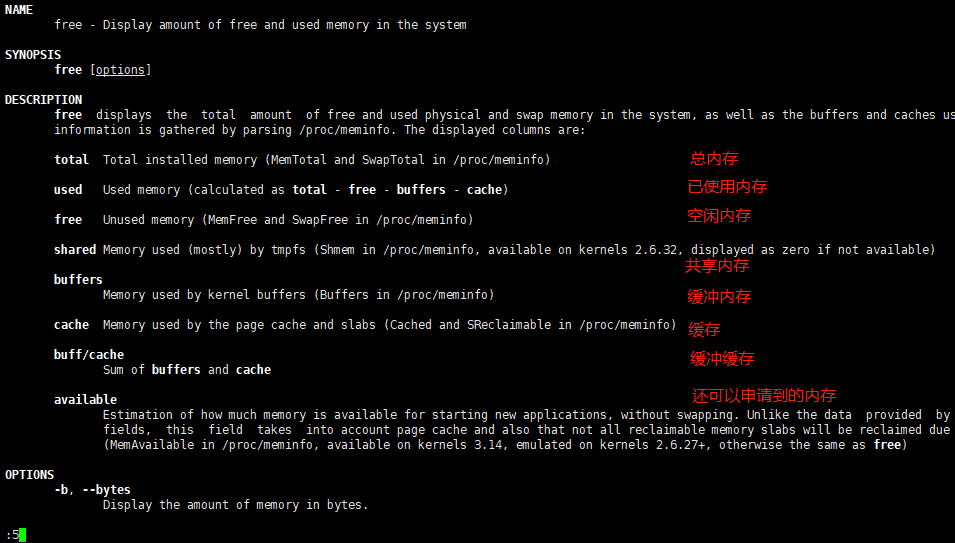
available = free+部分缓存
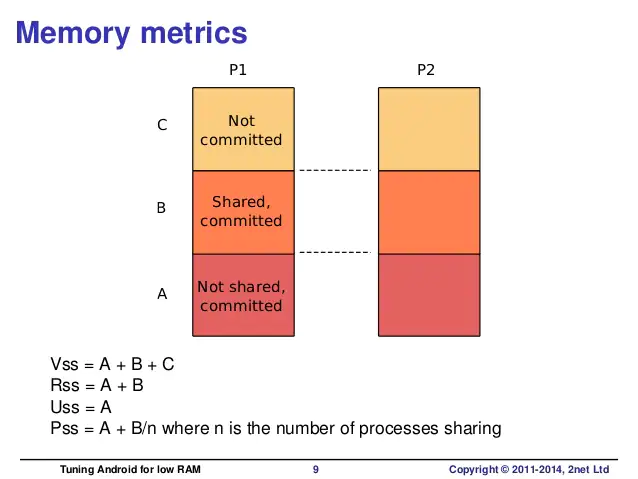
Vss:虚拟内存
Rss:
Uss:已使用内存
Pss:单个进程占用内存
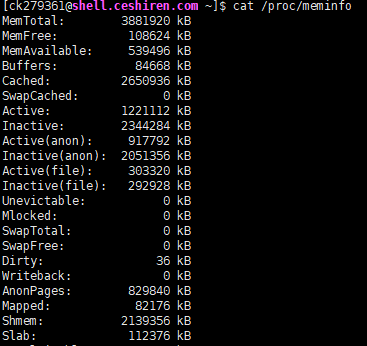
/proc/menifo保存了更多的内存使用情况
- ps:
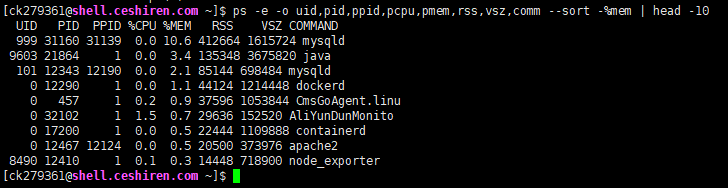
进程级别的内存分析,可以使用ps
- top
五、网络链接统计
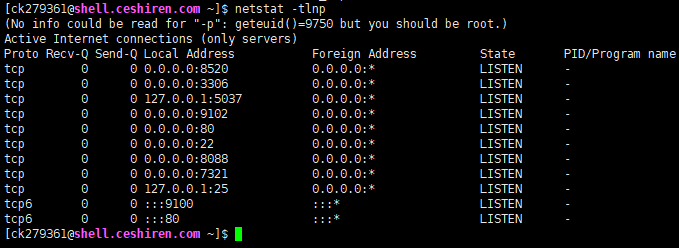
- netstat -tlnp
- t tcp
- l listening
- n 解析域名
- p 打印进程
网络状态
- ESTABLISHED 成功连接 The socket has an established connection
- SYN_SENT The socket is actively attempting to establish a connection
- SYN_RECV A connection request has been received from the network.
- FIN_WAIT1 The socket is closed, and the connection is shutting down.
- FIN_WAIT2 Connection is closed, and the socket is waiting for a shutdown from the remote end
- TIME_WAIT 主动关闭 The socket is waiting after close to handle packets still in the network
- CLOSE The socket is not being used
- CLOSE_WAIT 被动关闭 The remote end has shut down, waiting for the socket to close.
- LISTEN The socket is listening for incoming connections