一, 专项测试介绍
1,定义
App 专项测试是一种针对 App 的性能、稳定性、兼容性、耗电量等方面进行的专项测试。它通过一系列的测试手段和工具来分析 App 的各项性能指标,并对性能瓶颈进行优化,以提升用户的使用体验。
- 业务测试(面向新需求)
- 回归测试(面向已交付需求)
- 非功能测试:针对专项质量问题的测试
- 移动端性能问题(硬件相关,比如 cpu、mem、disk、network、gpu)
- 移动端场景问题(场景相关,比如弱网测试、兼容性测试、国际化)
| 用户体验 | 原因 | 解决方案 |
|---|---|---|
| 崩溃 | Crash,弱网 | 自动遍历、monkey 测试、横竖屏切换、快速进退 |
| 卡顿 | 掉帧、gc、cpu | 卡顿测试、内存泄漏测试、method profile |
| 响应慢 | 启动时间、交互响应、H5 加载 | 冷热启动、界面切换、h5 性能测试 |
| 发热 | cpu,mem、io、network、gps 等硬件使用 | method profile、gc 统计、io 统计、流量统计、硬件使用统计、耗电量分析 |
| 掉电快 | 硬件占用 | 硬件使用统计、耗电量分析 |
| 兼容性问题 | 机型覆盖、回归 | 兼容性测试、自动化测试、自动遍历、monkey 测试 |
2,专项测试范围
- app 启动性能分析:冷启动、热启动、暖启动、首屏启动指标分析。
- app 首屏加载时间分析:使用 ffmpeg 录屏拆帧分析实战。
- 接口性能分析:dns、http/https 的接口性能分析。
- PC 浏览器的性能分析:PC 浏览器的性能数据获取与分析。
- 手机浏览器的性能分析:手机浏览器的性能数据获取与分析。
- app webview 性能分析:hybrid app 的性能分析。
- 微信小程序性能分析:微信小程序性能数据获取与分析。
- W3C performance api:性能 api 的讲解、调用与实战。
- 卡顿分析:过度绘制、冰冻帧、卡顿数据。
- 系统资源分析:cpu 统计、mem 统计、网络流量分析。
- 耗电量测试:使用 Batterystats 与 BatteryHistorian 完成耗电量分析。
- 弱网测试:模拟弱网、丢包、延迟、不可访问等多种条件下的应用体验。
- 健壮性测试:使用 monkey maxim 完成 app 的健壮性测试。
- 兼容性测试:使用 appcrawler 完成遍历与兼容性分析。
二,专项测试讲解
1,app 启动性能分析
(1)Activity启动流程
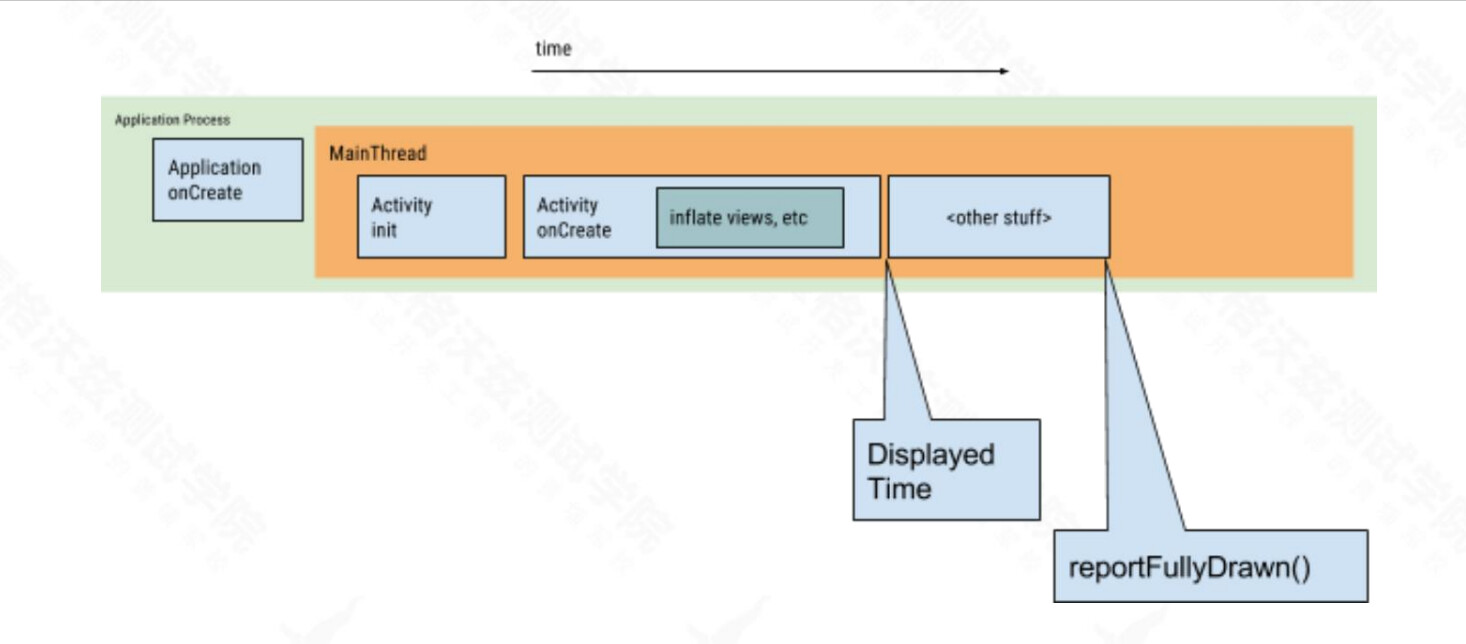
- Application OnCreate
❖ 加载第三方的sdk - Activity OnCreate
❖ 加载自身的逻辑
❖ 发送远程数据请求 xxx.json
❖ 渲染界⾯ List
(2)app启动性能指标
- 冷启动(Cold startup takes 5 seconds or longer)
- 暖启动(Hot startup takes 1.5 seconds or longer)
- 热启动(Warm startup takes 2 seconds or longer)
- 首屏启动
(3)主要流程
A,使用 adb logcat
package=com.xueqiu.android
清理缓存数据:adb shell pm clear $package
停止进程:adb shell am force-stop $package
启动app:adb shell am start -S -W $package/.view.WelcomeActivityAlias
获取数据:adb logcat |grep -i displayed

- startTime:记录刚准备调用startActivityAndWait()的时间点;
- endTime:记录startActivityAndWait()函数调用返回的时间点
- WaitTime:startActivityAndWait()调用耗时
- WaitTime = endTime - startTime
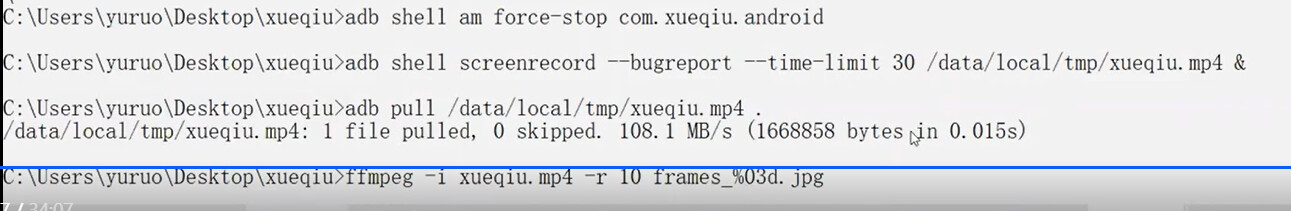
B,录屏+视频拆帧
- 使用ffmpeg拆帧
adb shell am force-stop $package
adb shell screenrecord --bugreport --time-limit 30 /data/local/tmp/xueqiu.mp4 &
adb shell am start -S -W $package/.view.WelcomeActivityAlias
wait
adb pull /data/local/tmp/xueqiu.mp4 .
ffmpeg -i xueqiu.mp4 xueqiu.gif
ffmpeg -i xueqiu.mp4 -r 10 frames_%03d.jp
C,uiautomator等自动化工具200ms巡检界⾯变化
D, traceview
E,硬埋点
2,app 首屏加载时间分析
- 使用ffmpeg拆帧
adb shell am force-stop $package
adb shell screenrecord --bugreport --time-limit 30 /data/local/tmp/xueqiu.mp4 &
手动打开app
adb pull /data/local/tmp/xueqiu.mp4 .
ffmpeg -i xueqiu.mp4 -r 10 frames_%03d.jp
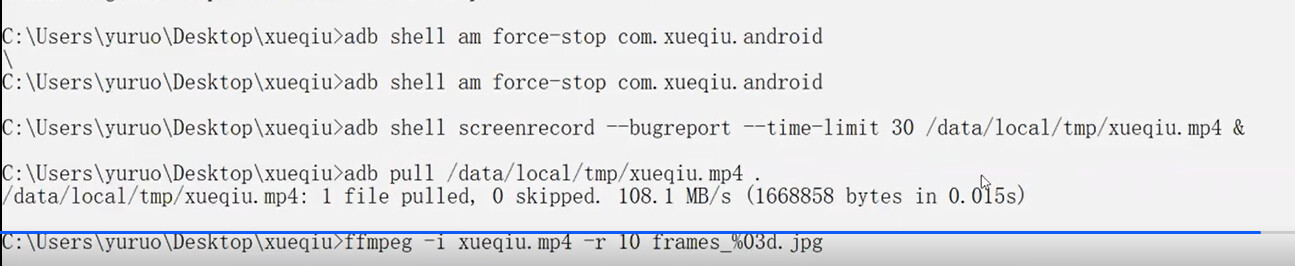
- 通过逐帧分析,找到点击app的时间点,到app启动打开首页的时间来计算首屏加载时间
3,PC浏览器性能分析
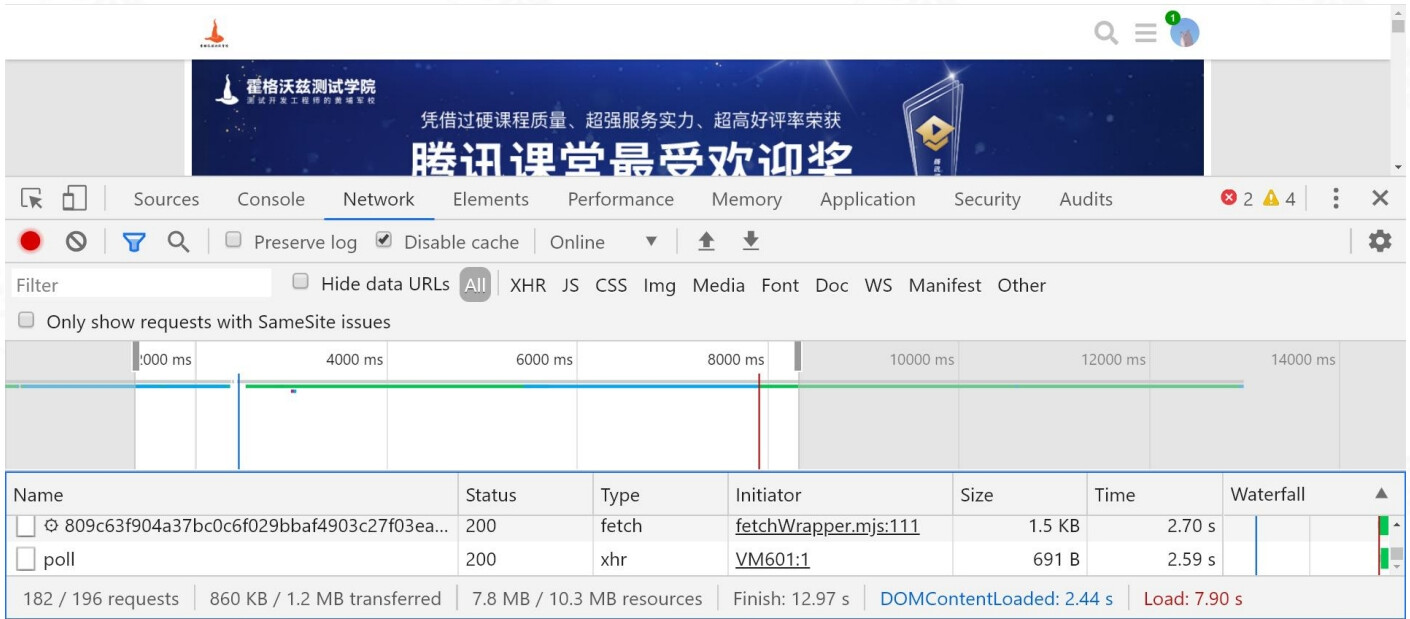
(1)chrome浏览器自带分析工具
-
Disable cache:不加载缓存,从零载入
-
蓝色线:dom出现
-
红色线: 图片等资源已加载完
-
详细信息

(2)信息指标
- Queueing:队列等待时间
- Stalled:在队列中,停止请求
- Waiting:服务器响应时间
- Content Download:下载时间
4,手机浏览器性能分析
(1)资源加载指标
-
prompt for unload:访问一个新页面时,旧页面卸载完成的时间
-
redirect:重定向,用户注销登陆时返回主页面和跳转到其它的网站等
-
app cache:检查缓存,是否打开
-
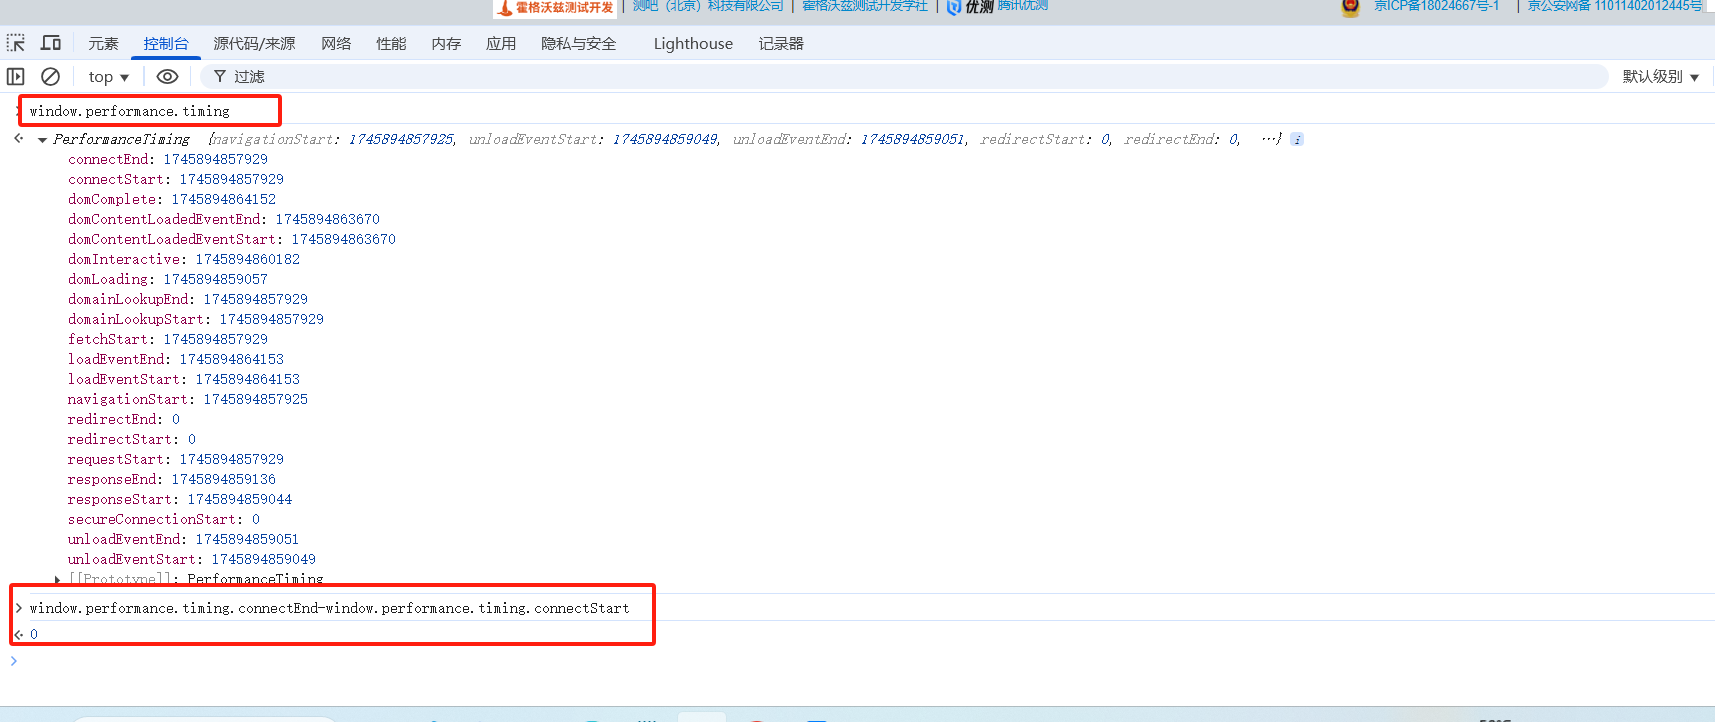
DNS(域名系统 ):DNS查询的时间,如果是长连接或者请求文件来自缓存等本地存储则返回fetchStart时间点
-
TCP:与服务器建立链接的时间
-
request:浏览器发起请求的时间
-
response:拿到第一个响应字节到最后一个响应字节的时间
-
processing:各种状态的时间点
-
load:触发load事件执行的时间
(2)获取单个资源的性能
(3)自动化获取性能指标
-
appium/selenium的ExecuteScript Api
-
注⼊js
-
return JSON.stringify(window.performance.timing)
-
JSON.stringify(window.performance.getEntriesByName(document.querySelector(“img”).src)[0], null, 2)
-
代码示例
 @Test
    void trainTest() throws InterruptedException {
        driver.get("https://ceshiren.com/");
        //声明一个js实例
        JavascriptExecutor js = (JavascriptExecutor) driver;
        Object executeScript = js.executeScript("return JSON.stringify(window.performance.timing)");
        System.out.println(executeScript);

        Object script = js.executeScript("JSON.stringify(window.performance.getEntriesByName(document.querySelector(\"img\").src)[0], null, 2)");
        System.out.println(script);
    }
5,卡顿分析
卡顿分析.pdf (641.1 KB)
6,系统资源分析
系统资源分析.pdf (955.7 KB)
7,耗电量测试
耗电量测试.pdf (451.5 KB)
8,弱网测试
弱网测试.pdf (438.0 KB)
9,健壮性测试
健壮性测试.pdf (161.4 KB)
10,兼容性测试
兼容性测试.pdf (170.6 KB)