这是自己配置的模板
——————————————————
准备的一些数据:
前提:grafana—prometheus,均是docker启动的,已经配置了同一网络
1.监控的是自己的本机-macOS
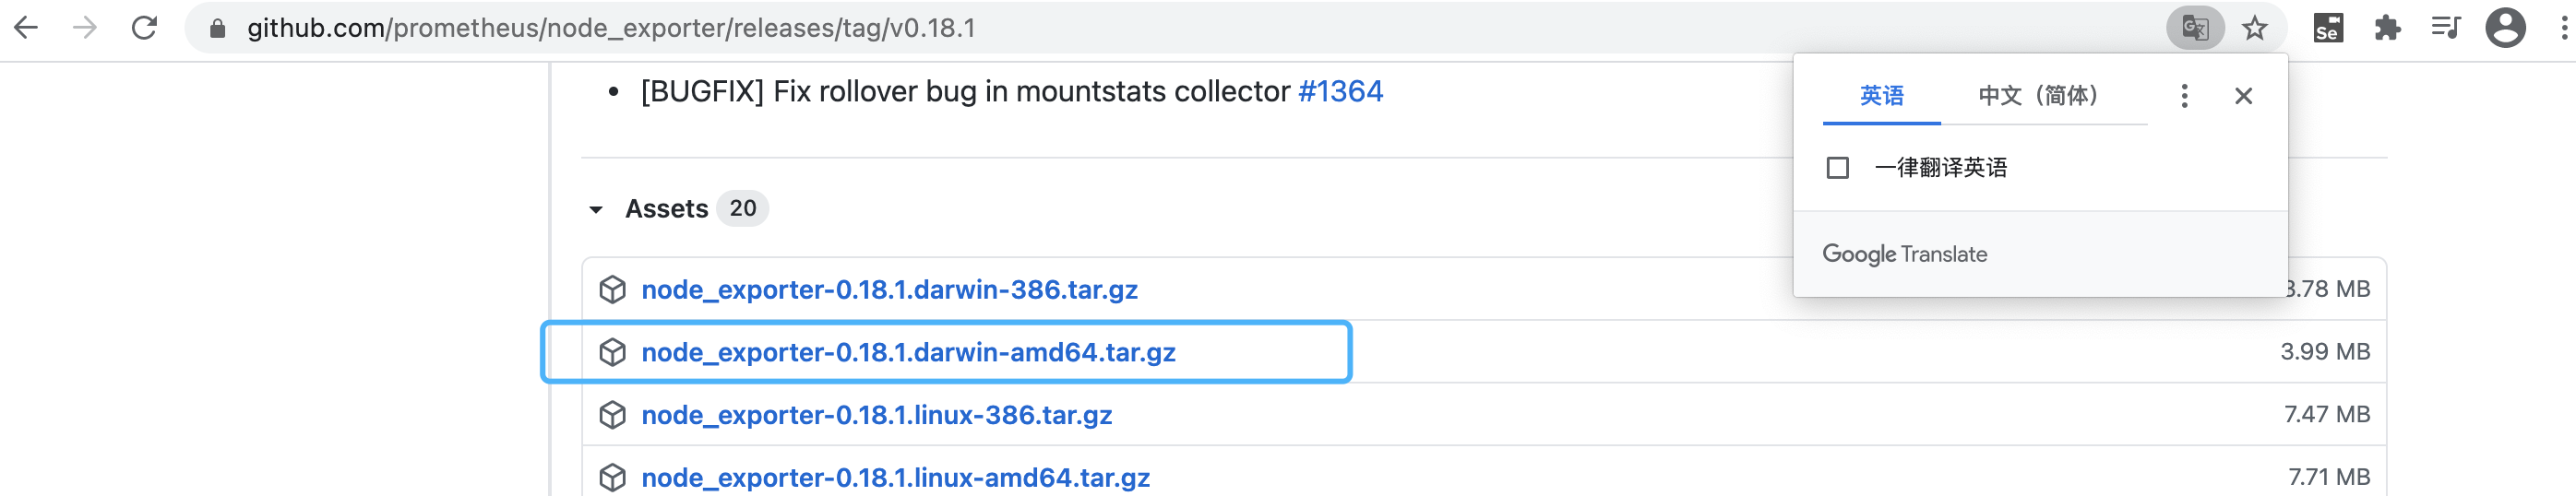
2.下载的node_exporter是
3.node_exporter运行的命令是:nohup ./node_exporter --web.listen-address=“:9102” &
4.本机ip是192.168.0.100
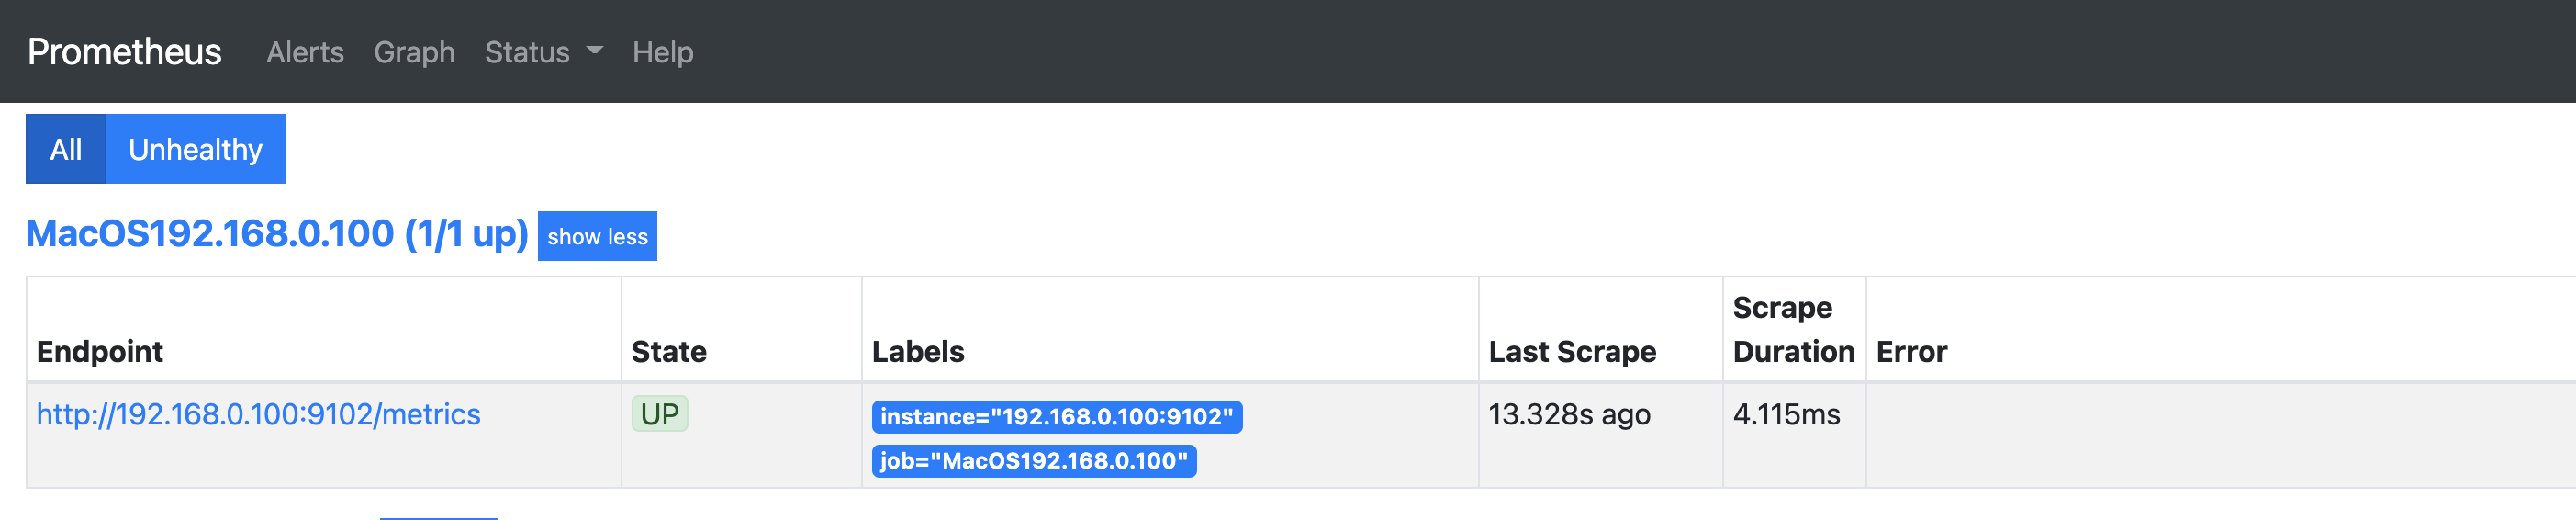
5.prometheus中的数据显示:
6.prometheus的yaml文件配置
  - job_name: 'MacOS192.168.0.100'
    static_configs:
    - targets: ['192.168.0.100:9102']
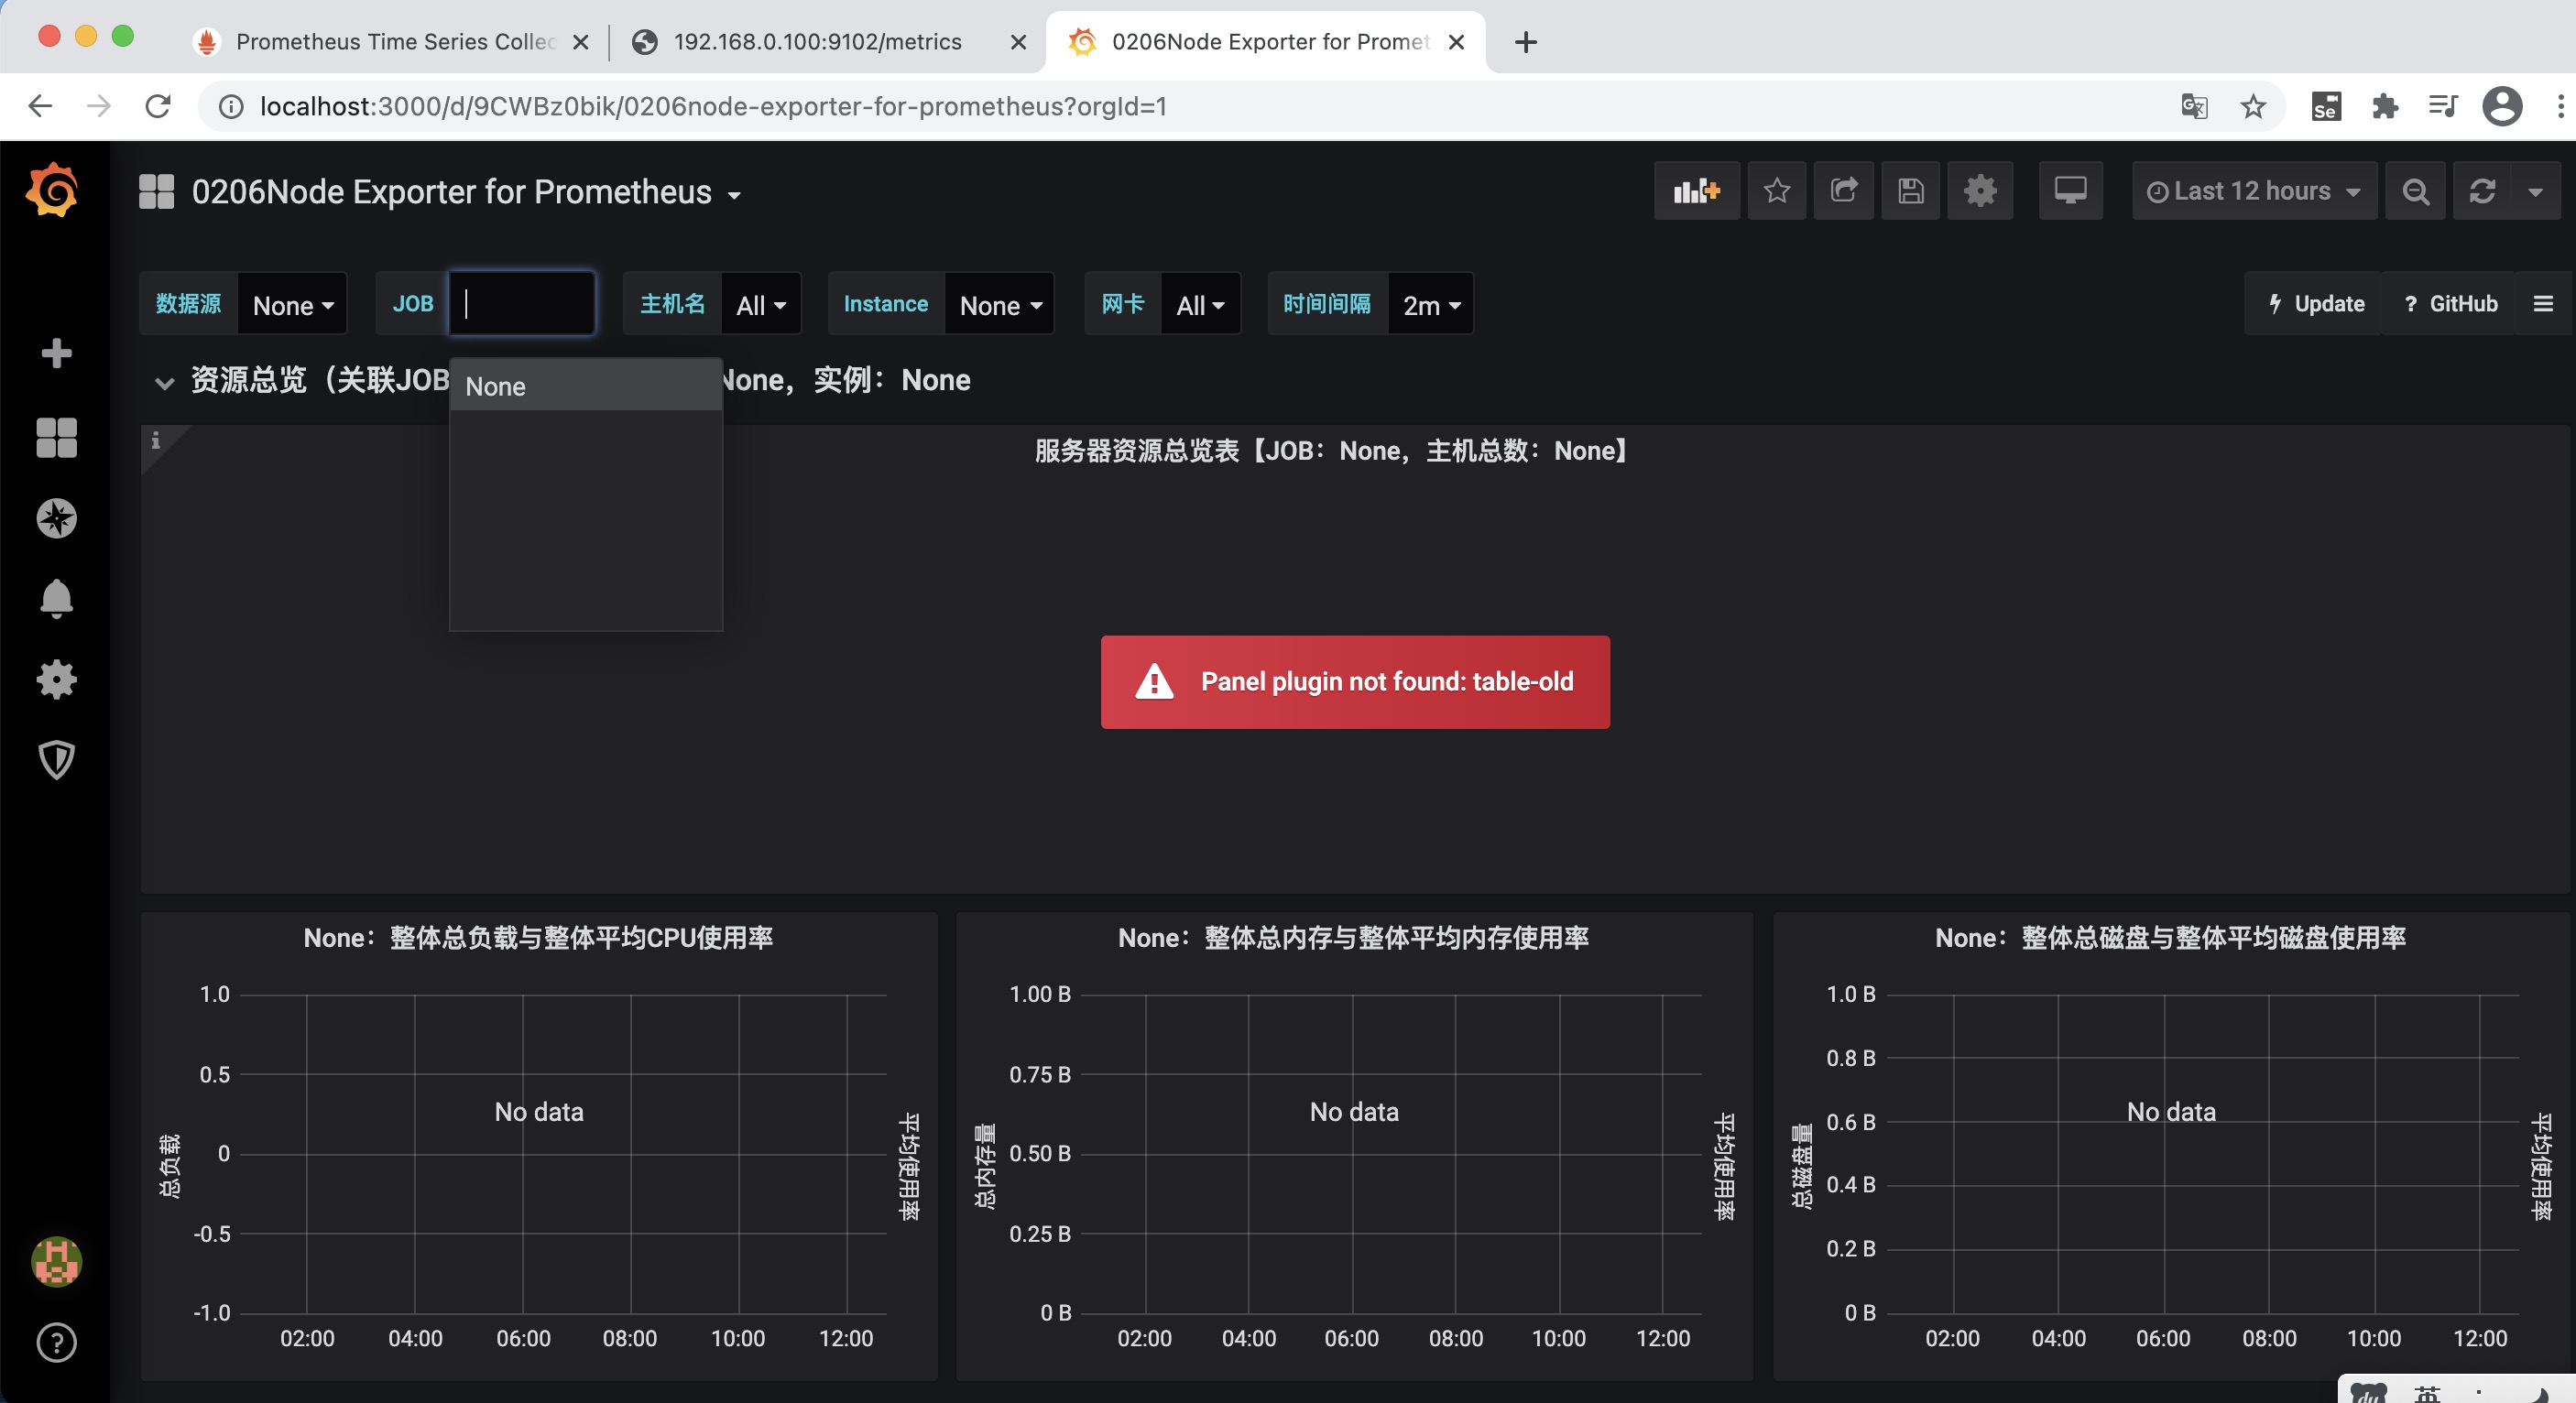
7.grafana选择的模板:
8.dashboards配置:
麻烦老师帮忙看下原因为啥没显示出来数据。
追加:
我当时创建的prometheus文件是在本地目录。
使用这个docker命令没错吧
docker run -d -p 9090:9090 --name prometheus --network grafana -v ${PWD}/prometheus.yml:/etc/prometheus.yml prom/prometheus:v2.16.0 --config.file=/etc/prometheus.yml
位置1:
${PWD}/prometheus.yml:/etc/prometheus.yml
位置2
config.file=/etc/prometheus.yml
位置1和位置2这么写没错把
Jaxon
(霍格沃兹-修然)
3
检查下prometheus的target里是否有主机的数据
Jaxon
(霍格沃兹-修然)
4
prometheus.yml 这个文件的内容发下看看