-
问题1:Prometheus的Targets连接的node_export中出现提示“Get http://172.25.137.116:9100/metrics: context deadline exceeded”
截图如下:
-
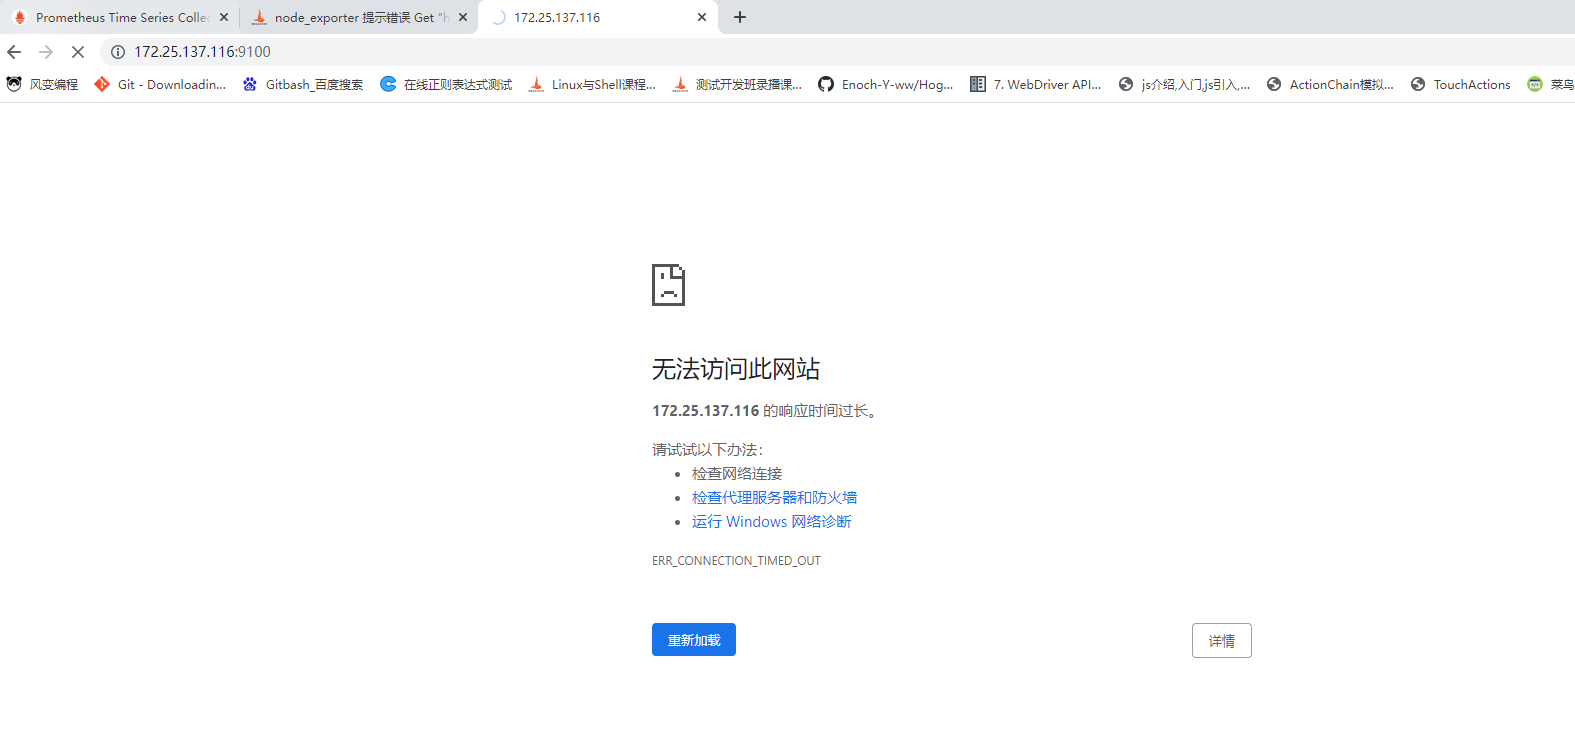
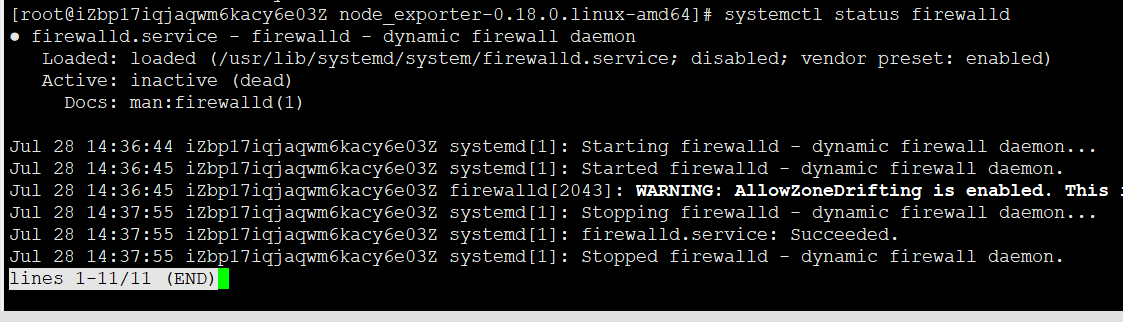
问题2:连接到node_exporter对应的url也显示无法访问,看了防火墙也是关闭的,不知为啥访问不到

-
使用环境:
node_exporter版本:0.18.0
系统:linux -
prometheus.yml配置文件中的代码如下:
# my global config
global:
  scrape_interval: 10s # Set the scrape interval to every 15 seconds. Default is every 1 minute.
  scrape_timeout: 10s # Evaluate rules every 15 seconds. The default is every 1 minute.
  # scrape_timeout is set to the global default (10s).

# Alertmanager configuration
alerting:
  alertmanagers:
    - static_configs:
        - targets:
          # - alertmanager:9093

# Load rules once and periodically evaluate them according to the global 'evaluation_interval'.
rule_files:
  # - "first_rules.yml"
  # - "second_rules.yml"

# A scrape configuration containing exactly one endpoint to scrape:
# Here it's Prometheus itself.
scrape_configs:
  # The job name is added as a label `job=<job_name>` to any timeseries scraped from this config.
  - job_name: "prometheusing123"

    # metrics_path defaults to '/metrics'
    # scheme defaults to 'http'.

    static_configs:
      - targets: ["localhost:9090"]


  - job_name: "prometheusing"
    static_configs:
            - targets: ["172.25.137.116:9100"]
烦请老师有空帮忙解答一下