以下是使用 DTrace 的开源工具和示例,DTrace 是在不同操作系统(Solaris、Mac OS X、FreeBSD 等)中可用的动态跟踪实现。DTrace 通过提供应用程序和系统内部的新详细视图来帮助解决服务器上的问题,达到以前难以或不可能访问的级别。它提供了一种语言来编写类似于 C 和 awk 并且基于事件的 DTrace 脚本。有关更长的摘要,请参阅 wikipedia DTrace条目。
这个网站包含了我的许多第一个 DTrace 脚本,它们是在 2004 年 5 月在预发行版 Solaris 10 上编写的。这些脚本被开发成一个名为DTraceToolkit的集合,其中包含此处找到的较新版本的脚本。我最近的收藏发表在右图所示的 DTrace 书(Prentice Hall,2011 年)中,其中包含许多新脚本。这些新脚本可以在www.dtracebook.com网站上找到。
在此页面上: Linux、 指南、 DTraceToolkit、 DTrace One-Liners、 脚本、 示例、 DTraceTazTool、 DExplorer、 链接。
操作系统
DTrace 可用于 Mac OS X、FreeBSD 和 Solaris 操作系统系列:Solaris 10、Oracle Solaris 11、SmartOS、OmniOS 以及基于 illumos 内核的任何其他操作系统。
此页面上的许多 DTrace 脚本最初是为 Solaris 10 编写的。有些可以在其他操作系统上运行而无需更改,有些则需要稍作调整才能运行。
Linux
从 Linux 4.9 开始,Linux 内核终于拥有与 DTrace 类似的原始功能。这是多年来在 Linux 内核中合并的许多跟踪项目和技术的巅峰之作,包括:分析和 PMC 事件 (perf_events)、内核静态跟踪 (tracepoints)、内核动态跟踪 (kprobes) 和用户动态跟踪 (长袍)。以前的 Linux 跟踪器是 ftrace 和 perf_events。新的 Linux 跟踪器建立在所有这些之上,是增强的 BPF,具有多个可用的前端:特别是 bcc 和 bpftrace。请参阅我的帖子:DTrace for Linux 2016 (eBPF)和DTrace for Linux 2018 (bpftrace)。我还有一个关于Linux eBPF Tracing的页面。
如果您想要类似 DTraceToolkit 的体验(罐装工具),请查看bcc。如果您想要类似 DTrace 的体验(D 编程),请查看bpftrace。我已经为两者发布了工具。
对于 eBPF 之前的 Linux 跟踪,我编写了一个 ftrace 和 perf_events 工具的集合,类似于 DTraceToolkit,它们在较旧的 Linux 内核上运行:perf-tools ,我也在 LISA, Linux 性能分析:新工具和旧秘密中谈到了.
附加组件怎么样,例如 SystemTap、ktap 等?现在 eBPF 已经包含在 4.9 中,所有附加组件都应该考虑使用 eBPF 来实现后端功能。这从 2017 年开始,并将在 2019 年继续,随着 4.9 内核的推出以及对 eBPF 工具的更多需求。要查看有关这些附加跟踪器的一些较旧的材料,我确实有一个ktap页面,并在 2014 年发表了一次演讲,从 DTrace 到 Linux。至于 DTrace 本身,有两个项目可以将其移植到 Linux:dtrace4linux项目,以及用于 Oracle Linux 的不同端口。这些端口似乎没有动力,而 bcc/eBPF 有。
指导
如何开始使用 DTrace?您可以通过运行脚本来使用 DTrace,或者您可以自己编写它们。
使用 DTrace 脚本
不是每个人都有时间坐下来从头开始编写 DTrace 脚本,或者有时间学习如何操作。不用担心,网上有很多脚本可供下载和使用。你可以:
-
查看 DTrace OneLiners。
-
请参阅DTrace book中的 DTrace 脚本和单行代码。
-
使用 /usr/demo/dtrace 或DTrace Guide中的脚本。
-
在 DTrace邮件列表中搜索有用的脚本,或在 Internet 上的其他地方搜索。
编写 DTrace 脚本
有些人会编写自己定制的 DTrace 脚本来排查故障或解决性能问题。
- 了解 C 会有所帮助
- 对内核有所了解会有所帮助
- 天空是极限
要开始编写自己的脚本:
- 阅读DTrace Guide的第 1 章(至少) 。
- 查看 DTrace OneLiners。
- 通读 DTrace示例。
- 学习脚本。最好的顺序是 kill.d、 bitesize.d、 sshkeysnoop.d、 shellsnoop.d。
- 有关脚本,请参见其他网站。
- 下载DTraceToolkit
- 阅读DTrace 书。
- 参与 DTrace邮件列表。
注意:本站点上的许多 DTrace 脚本已封装在 Bourne shell 或 Perl 中,以提供命令行选项,允许通过遵循其他现有约定和样式为系统管理员创建直观且易于学习的工具Unix 工具。
DTrace 工具包
请参阅DTraceToolkit 网站(请更新指向它的链接)。
DTrace 一号线
这些是在命令行中使用的方便的一个衬垫。 dtrace_oneliners.txt 包含带有示例的完整列表。
# New processes with arguments:
dtrace -n 'proc:::exec-success { trace(curpsinfo->pr_psargs); }'

# Files opened by process:
dtrace -n 'syscall::open*:entry { printf("%s %s",execname,copyinstr(arg0)); }'

# Syscall count by program:
dtrace -n 'syscall:::entry { @num[execname] = count(); }'

# Syscall count by syscall:
dtrace -n 'syscall:::entry { @num[probefunc] = count(); }'

# Syscall count by process:
dtrace -n 'syscall:::entry { @num[pid,execname] = count(); }'

# Read bytes by process:
dtrace -n 'sysinfo:::readch { @bytes[execname] = sum(arg0); }'

# Write bytes by process:
dtrace -n 'sysinfo:::writech { @bytes[execname] = sum(arg0); }'

# Read size distribution by process:
dtrace -n 'sysinfo:::readch { @dist[execname] = quantize(arg0); }'

# Write size distribution by process:
dtrace -n 'sysinfo:::writech { @dist[execname] = quantize(arg0); }'

# Disk size by process:
dtrace -n 'io:::start { printf("%d %s %d",pid,execname,args[0]->b_bcount); }'

# Pages paged in by process:
dtrace -n 'vminfo:::pgpgin { @pg[execname] = sum(arg0); }'

# Minor faults by process:
dtrace -n 'vminfo:::as_fault { @mem[execname] = sum(arg0); }'

# Profile user-level stacks at 99 Hertz, for PID 189:
dtrace -n 'profile-99 /pid == 189 && arg1/ { @[ustack()] = count(); }'
DTrace 书中也有许多单行代码,以及系统性能书的附录D。
脚本
下面通过下载代码的链接演示每个程序的操作。(注意:要获取特定脚本的最新版本,还要检查 DTraceToolkit中的版本)。
iosnoop 是一个监听磁盘 I/O 活动的程序。在这里,我们可以实时观看磁盘上发生的事情,包括 PID 和负责的命令。输出包括磁盘操作的块地址和大小 - 这是您第一次可以实时查看磁盘正在做什么。
# iosnoop
  UID   PID D    BLOCK   SIZE       COMM PATHNAME
  100 15795 R     3808   8192        tar /usr/bin/eject
  100 15795 R    35904   6144        tar /usr/bin/eject
  100 15795 R    39828   6144        tar /usr/bin/env
  100 15795 R     3872   8192        tar /usr/bin/expr
  100 15795 R    21120   7168        tar /usr/bin/expr
  100 15795 R    43680   6144        tar /usr/bin/false
  100 15795 R    44176   6144        tar /usr/bin/fdetach
  100 15795 R     3920   8192        tar /usr/bin/fdformat
  100 15795 R     3936   8192        tar /usr/bin/fdformat
  100 15795 R     4080   8192        tar /usr/bin/fdformat
  100 15795 R     9680   3072        tar /usr/bin/fdformat
[...]
下面说明了由熟悉的 Unix 命令引起的磁盘活动。iosnoop 在 Solaris 10 x86 服务器上执行并绘制了数据 - 磁盘头位置(红色)和传输大小(蓝色)。点击查看大图:
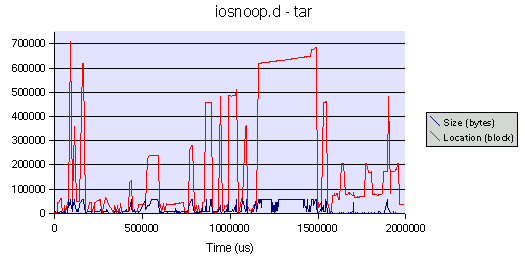
这里执行了一个 tar 命令(tar cvf /dev/null /var)来归档一个目录,而 iosnoop 捕获了前 2 秒的磁盘活动。在 tar 读取目录时会观察到一些分散的活动,并且在 tar 遇到大文件时可以观察到顺序传输。
- 更多 iosnoop 示例 包含更多演示和绘图。
- 独立的 iosnoop.d是仅 DTrace 版本,这里有示例,旧的 pre-io 提供程序 iosnoop.d 在 这里。
- psio是另一个启用 DTrace 的磁盘 I/O 工具。
iotop 按进程显示顶级磁盘 I/O 事件。这会按进程跟踪磁盘 I/O,并打印每个间隔刷新的摘要报告。完整 的例子。 第一次发布。检查更新。
# iotop -C
Sampling... Please wait.
2005 Jul 16 00:31:38,  load: 1.03,  disk_r:   5023 Kb,  disk_w:     22 Kb

  UID    PID   PPID CMD              DEVICE  MAJ MIN D            BYTES
    0  27740  20320 tar              cmdk0   102  16 W            23040
    0  27739  20320 find             cmdk0   102   0 R           668672
    0  27740  20320 tar              cmdk0   102  16 R          1512960
    0  27740  20320 tar              cmdk0   102   3 R          3108864

2005 Jul 16 00:31:43,  load: 1.06,  disk_r:   8234 Kb,  disk_w:      0 Kb

  UID    PID   PPID CMD              DEVICE  MAJ MIN D            BYTES
    0  27739  20320 find             cmdk0   102   0 R          1402880
    0  27740  20320 tar              cmdk0   102   3 R          7069696
[...]
execsnoop 是一个监听进程活动的程序。当进程在服务器上执行时,它们的详细信息会被打印出来。另一个用户登录运行了一些命令,如下所示。这对于排除难以发现的短期流程特别有用。更多 例子。
# execsnoop
  UID   PID  PPID CMD
  100  3008  2656 ls
  100  3009  2656 ls -l
  100  3010  2656 cat /etc/passwd
  100  3011  2656 vi /etc/hosts
  100  3012  2656 date
  100  3013  2656 ls -l
  100  3014  2656 ls
  100  3015  2656 finger
[...]
- Execsnoop 具有添加日期和时间 (-v) 或监视特定命令 (-c 命令) 的选项。
- 独立的 execsnoop.d是原始的 DTrace 唯一版本。
- C 版本:execsnoop.c用于比较 libdtrace C 使用者和 D 脚本之间的开销。
opensnoop 是一个监听文件打开的程序。跟踪文件名和文件句柄以及一些进程细节。更多 例子。
# opensnoop -g
  UID   PID PATH                                   FD ARGS
  100  3528 /var/ld/ld.config                      -1 cat /etc/passwd
  100  3528 /usr/lib/libc.so.1                      3 cat /etc/passwd
  100  3528 /etc/passwd                             3 cat /etc/passwd
  100  3529 /var/ld/ld.config                      -1 cal
  100  3529 /usr/lib/libc.so.1                      3 cal
  100  3529 /usr/share/lib/zoneinfo/Australia/NSW   3 cal
  100  3530 /var/ld/ld.config                      -1 ls -l
  100  3530 /usr/lib/libc.so.1                      3 ls -l
  100  3530 /var/run/name_service_door              3 ls -l
  100  3530 /usr/share/lib/zoneinfo/Australia/NSW   4 ls -l
  100  3531 /var/ld/ld.config                      -1 uname -a
  100  3531 /usr/lib/libc.so.1                      3 uname -a
[...]
- Opensnoop 具有添加日期和时间 (-v) 或查看特定文件名 (-f 路径名) 的选项。
- 独立的 opensnoop.d是原始的 DTrace 唯一版本。
rwsnoop snoop 读/写事件。这是在应用程序级别测量读取和写入 - 系统调用。完整 的例子。
# rwsnoop
  UID    PID CMD          D   BYTES FILE
    0   2924 sh           R     128 /etc/profile
    0   2924 sh           R     128 /etc/profile
    0   2924 sh           R     128 /etc/profile
    0   2924 sh           R      84 /etc/profile
    0   2925 quota        R     757 /etc/nsswitch.conf
    0   2925 quota        R       0 /etc/nsswitch.conf
    0   2925 quota        R     668 /etc/passwd
    0   2926 cat          R      55 /etc/motd
    0   2926 cat          W      55 /devices/pseudo/pts@0:12
  100  20334 sshd         R      56 /devices/pseudo/clone@0:ptm
  100  20334 sshd         W     100 <unknown>
    0   2926 cat          R       0 /etc/motd
    0   2927 mail         R     757 /etc/nsswitch.conf
    0   2927 mail         R       0 /etc/nsswitch.conf
    0   2927 mail         R     275 /etc/group
    0   2927 mail         R     668 /etc/passwd
    0   2924 sh           R       0 /etc/profile
[...]
rwtop 按进程显示最高读/写字节。rwtop 打印一个定期刷新的摘要报告。这是在应用程序级别测量读取和写入 - 系统调用。完整 的例子。
# rwtop
2005 Jul 24 05:00:13,  load: 1.01,  app_r:     38 Kb,  app_w:      8 Kb

  UID    PID   PPID CMD              D            BYTES
    0    245      1 utmpd            R                4
    0  20320  20347 bash             R               21
  100  20317  20314 sshd             R               26
  100  20317  20314 sshd             W               68
    0   2934  20320 ps               W              140
    0  20320  20347 bash             W              216
    0      7      1 svc.startd       R              672
    0   2935  20320 df               W             1225
    0   2936  20320 ls               W             1466
    0   2936  20320 ls               R             2485
  100  20334  20331 sshd             R             4241
  100  20334  20331 sshd             W             5717
    0   2934  20320 ps               R            31567
tcpsnoop 按进程侦听 TCP 网络数据包。这会分析 TCP 网络数据包并打印负责的 PID 和 UID,以及 IP 地址和端口等标准详细信息。这将捕获在该程序运行时建立的新创建的 TCP 连接的流量。它可以帮助识别导致 TCP 流量的进程。完整 的例子。 新版本。检查更新。
# tcpsnoop.d
  UID    PID LADDR           LPORT DR RADDR           RPORT  SIZE CMD
  100  20892 192.168.1.5     36398 -> 192.168.1.1        79    54 finger
  100  20892 192.168.1.5     36398 -> 192.168.1.1        79    54 finger
  100  20892 192.168.1.5     36398 <- 192.168.1.1        79    54 finger
    0    242 192.168.1.5        23 <- 192.168.1.1     54224    54 inetd
    0    242 192.168.1.5        23 -> 192.168.1.1     54224    54 inetd
    0    242 192.168.1.5        23 <- 192.168.1.1     54224    54 inetd
    0    242 192.168.1.5        23 <- 192.168.1.1     54224    78 inetd
    0    242 192.168.1.5        23 -> 192.168.1.1     54224    54 inetd
    0  20893 192.168.1.5        23 -> 192.168.1.1     54224    57 in.telnetd
    0  20893 192.168.1.5        23 <- 192.168.1.1     54224    54 in.telnetd
    0  20893 192.168.1.5        23 -> 192.168.1.1     54224    78 in.telnetd
    0  20893 192.168.1.5        23 <- 192.168.1.1     54224    57 in.telnetd
    0  20893 192.168.1.5        23 -> 192.168.1.1     54224    54 in.telnetd
[...]
- 独立 tcpsnoop.d是仅 DTrace 版本。
tcptop 按进程显示顶部 TCP 网络数据包。这将捕获在该程序运行时建立的新创建的 TCP 连接的流量。它可以帮助识别导致 TCP 流量的进程。完整 的例子。 第一次发布。检查更新。
# tcptop -C 30
Sampling... Please wait.
2005 Jul  5 05:18:56,  load: 1.07,  TCPin:      3 Kb,  TCPout:    112 Kb

 UID    PID LADDR           LPORT RADDR           RPORT      SIZE NAME
   0    242 192.168.1.5        79 192.168.1.1     54283       272 inetd
   0    242 192.168.1.5        23 192.168.1.1     54284       294 inetd
   0  20929 192.168.1.5        79 192.168.1.1     54283       714 in.fingerd
 100  20926 192.168.1.5     36409 192.168.1.1        79      1160 finger
 100  20927 192.168.1.5     36410 192.168.1.1        79      1160 finger
 100  20928 192.168.1.5     36411 192.168.1.1        23      1627 telnet
   0  20313 192.168.1.5        22 192.168.1.1     54285      2798 sshd
   0  20931 192.168.1.5        23 192.168.1.1     54284      4622 in.telnetd
 100  20941 192.168.1.5       858 192.168.1.1       514    115712 rcp

2005 Jul  5 05:19:26,  load: 1.04,  TCPin:      0 Kb,  TCPout:      4 Kb

 UID    PID LADDR           LPORT RADDR           RPORT      SIZE NAME
 100  20942 192.168.1.5     36412 192.168.1.1        79      1160 finger
   0  20931 192.168.1.5        23 192.168.1.1     54284      7411 in.telnetd
[...]
udpsnoop.d 按进程侦听 UDP 网络 I/O。这会分析 UCP 网络 I/O 并打印负责的 PID 和 UID,以及 IP 地址和端口等标准详细信息。这会按有效负载跟踪 UDP 读/写。完整 的例子。 第一次发布!检查更新
# udpsnoop.d
  UID    PID LADDR           LPORT DR RADDR           RPORT  SIZE CMD
    0  27127 192.168.1.5     35534 -> 192.168.1.1        53    29 nslookup
    0  27127 192.168.1.5     35534 <- 192.168.1.1        53   181 nslookup
    1    221 192.168.1.5       111 <- 192.168.1.1     37524    56 rpcbind
    1    221 192.168.1.5       111 -> 192.168.1.1     37524    28 rpcbind
    0  27128 192.168.1.5     35116 <- 192.168.1.1     37524    40 rpc.sprayd
    0  27128 192.168.1.5     35116 -> 192.168.1.1     37524    24 rpc.sprayd
    0  27128 192.168.1.5     35116 <- 192.168.1.1     37524    44 rpc.sprayd
    0  27128 192.168.1.5     35116 <- 192.168.1.1     37524    44 rpc.sprayd
    0  27128 192.168.1.5     35116 <- 192.168.1.1     37524    44 rpc.sprayd
    0  27128 192.168.1.5     35116 <- 192.168.1.1     37524    44 rpc.sprayd
    0  27128 192.168.1.5     35116 <- 192.168.1.1     37524    44 rpc.sprayd
    0  27128 192.168.1.5     35116 <- 192.168.1.1     37524    44 rpc.sprayd
    0  27128 192.168.1.5     35116 <- 192.168.1.1     37524    44 rpc.sprayd
    0  27128 192.168.1.5     35116 <- 192.168.1.1     37524    44 rpc.sprayd
    0  27128 192.168.1.5     35116 <- 192.168.1.1     37524    44 rpc.sprayd
    0  27128 192.168.1.5     35116 <- 192.168.1.1     37524    44 rpc.sprayd
    0  27128 192.168.1.5     35116 <- 192.168.1.1     37524    40 rpc.sprayd
    0  27128 192.168.1.5     35116 -> 192.168.1.1     37524    36 rpc.sprayd
^C
连接 在建立入站 TCP 连接时侦听它们,显示接受连接的服务器进程。完整的例子在 这里。
# connections
  UID   PID CMD          TYPE  PORT IP_SOURCE
    0   242 inetd         tcp    79 192.168.1.1
    0   359 sshd          tcp    22 192.168.1.1
  100  1532 Xorg          tcp  6000 192.168.1.1
^C
prustat 这按进程显示 %CPU、%Mem、%Disk 和 %Net 利用率。如果没有 DTrace,要在 Solaris 中按进程检查所有四个关键性能领域非常困难。prustat 还使用 Perl、Kstat 和 /proc// 中的 procfs 结构。 它是一个新工具,仍在开发中,作为演示发布。 完整的例子。
# prustat -t5 5
  PID   %CPU   %Mem  %Disk   %Net  COMM
22301  65.01   3.17   0.00   0.00  setiathome
  440   8.91  45.39   0.00   0.00  Xsun
 2618   0.33  14.34   0.00   0.00  mozilla-bin
  582   4.01   2.16   0.00   0.00  gnome-terminal
  574   1.80   1.31   0.00   0.00  metacity
  PID   %CPU   %Mem  %Disk   %Net  COMM
22694   3.74   0.20  74.47   0.00  tar
22301  66.70   3.17   0.00   0.00  setiathome
  440   6.67  45.39   0.00   0.00  Xsun
 2618   0.33  14.34   0.00   0.00  mozilla-bin
22693   3.81   1.50   0.00   0.00  dtrace
  PID   %CPU   %Mem  %Disk   %Net  COMM
22301  63.72   3.17   0.00   0.00  setiathome
  440   8.14  45.39   0.00   0.00  Xsun
22694   6.47   0.20  36.47   0.00  tar
22698   0.00   0.00   6.88  22.43  rcp
 2618   0.34  14.34   0.00   0.00  mozilla-bin
^C
dtruss 这是 truss 的 DTrace 版本,旨在减轻负担,比 truss 更安全。在下面的示例中,dtruss 检查所有名为“bash”的进程并打印出常规的 truss 输出以及经过时间和开销时间。请参阅完整 示例。
# dtruss -eon bash
PID/LWP    ELAPSD OVERHD SYSCALL(args)           = return
 3911/1:       41     26 write(0x2, "l\0", 0x1)          = 1 0
 3911/1:  1001579     43 read(0x0, "s\0", 0x1)           = 1 0
 3911/1:       38     26 write(0x2, "s\0", 0x1)          = 1 0
 3911/1:  1019129     43 read(0x0, " \001\0", 0x1)               = 1 0
 3911/1:       38     26 write(0x2, " \0", 0x1)          = 1 0
 3911/1:   998533     43 read(0x0, "-\0", 0x1)           = 1 0
 3911/1:       38     26 write(0x2, "-\001\0", 0x1)              = 1 0
 3911/1:  1094323     42 read(0x0, "l\0", 0x1)           = 1 0
 3911/1:       39     27 write(0x2, "l\001\0", 0x1)              = 1 0
 3911/1:  1210496     44 read(0x0, "\r\0", 0x1)          = 1 0
[...]
procsystime 该程序提供进程系统调用的详细信息,例如从进入到返回所用的时间、消耗的 CPU 时间的开销时间和计数。在下面的示例中,我们检查“ssh”进程。完整 的例子。
# procsystime -a -n ssh
Hit Ctrl-C to stop sampling...
^C

Elapsed Times for process ssh,

         SYSCALL          TIME (ns)
            read             295392
           write             622903
         pollsys         1030310531

CPU Times for process ssh,

         SYSCALL          TIME (ns)
            read             183515
           write             534289
         pollsys             650729

Syscall Counts for process ssh,

         SYSCALL              COUNT
            read                 12
           write                 12
         pollsys                 24
hotuser CPU 上的用户级函数和库示例。这个采样频率为 1000 赫兹,是一个简单而有效的用户级分析工具。输出将识别 CPU 上哪个功能最多 - 哪个是最热的。以下示例显示 hotuser 分析 gunzip 和 gzip。完整 的例子。
# ./hotuser -c 'gunzip contents.gz'
Sampling... Hit Ctrl-C to end.

FUNCTION                                                COUNT   PCNT
libc.so.1`_free_unlocked                                    1   0.1%
gunzip`unzip                                                1   0.1%
ld.so.1`strcmp                                              1   0.1%
gunzip`inflate_dynamic                                      1   0.1%
libc.so.1`_write                                            1   0.1%
gunzip`write_buf                                            1   0.1%
gunzip`0x2d990                                              2   0.3%
libc.so.1`write                                             2   0.3%
gunzip`0x2d994                                              2   0.3%
ld.so.1`rtld_db_preinit                                     3   0.4%
gunzip`0x2d98c                                              7   0.9%
gunzip`huft_build                                           9   1.2%
libc_psr.so.1`memcpy                                      138  18.5%
gunzip`inflate_codes                                      233  31.2%
gunzip`updcrc                                             344  46.1%


# ./hotuser -lc 'gzip contents'
Sampling... Hit Ctrl-C to end.

LIBRARY                                                 COUNT   PCNT
libc.so.1                                                   2   0.0%
libc_psr.so.1                                              37   0.9%
gzip                                                     4113  99.1%
hotkernel CPU 内核级函数和模块示例。这个采样频率为 1000 赫兹,是一个简单而有效的模块级分析工具。输出将识别 CPU 上哪个功能最多 - 哪个是最热的。以下示例显示了热内核分析 x86 内核。完整的例子。
# ./hotkernel
Sampling... Hit Ctrl-C to end.
^C
FUNCTION                                                COUNT   PCNT
unix`swtch                                                  1   0.1%
pcplusmp`apic_redistribute_compute                          1   0.1%
genunix`strrput                                             1   0.1%
unix`sys_call                                               1   0.1%
genunix`fsflush_do_pages                                    1   0.1%
TS`ts_wakeup                                                1   0.1%
genunix`callout_schedule_1                                  1   0.1%
unix`page_create_putback                                    1   0.1%
unix`mutex_enter                                            4   0.3%
unix`cpu_halt                                            1575  99.2%

# ./hotkernel -m
Sampling... Hit Ctrl-C to end.
^C
MODULE                                                  COUNT   PCNT
usbms                                                       1   0.0%
specfs                                                      1   0.0%
uhci                                                        1   0.0%
sockfs                                                      2   0.0%
genunix                                                    28   0.6%
unix                                                     4539  99.3%
dapptrace 这会跟踪用户和库函数的使用情况。这类似于“apptrace”命令,但是可以获取额外的详细信息,例如函数运行时间和 cpu 时间。下面是在横幅命令上运行 dapptrace 的演示,正在跟踪用户函数调用。完整 的例子。
# dapptrace -eoF banner hi

 #    #     #
 #    #     #
 ######     #
 #    #     #
 #    #     #
 #    #     #

 ELAPSD    CPU CALL(args)             = return
      .      .   -> __fsr(0x2, 0x8047D7C, 0x8047D88)
     41      4   <- __fsr = 122
      .      .   -> main(0x2, 0x8047D7C, 0x8047D88)
      .      .     -> banner(0x8047E3B, 0x80614C2, 0x8047D38)
      .      .       -> banset(0x20, 0x80614C2, 0x8047DCC)
     29      6       <- banset = 36
      .      .       -> convert(0x68, 0x8047DCC, 0x2)
     26      3       <- convert = 319
      .      .       -> banfil(0x8061412, 0x80614C2, 0x8047DCC)
     25      2       <- banfil = 57
      .      .       -> convert(0x69, 0x8047DCC, 0x2)
     23      1       <- convert = 319
      .      .       -> banfil(0x8061419, 0x80614CA, 0x8047DCC)
     23      1       <- banfil = 57
    309     28     <- banner = 118
      .      .     -> banprt(0x80614C2, 0x8047D38, 0xD27FB824)
    349    322     <- banprt = 74
dappprof 这描述了用户和库函数的使用情况。这是 dapptrace 的伴侣,其中打印摘要数据而不是事件的窥探。下面是在横幅命令上运行 dappprof 的演示。完整 的例子。
# dappprof -ceoT banner hello

 #    #  ######  #       #        ####
 #    #  #       #       #       #    #
 ######  #####   #       #       #    #
 #    #  #       #       #       #    #
 #    #  #       #       #       #    #
 #    #  ######  ######  ######   ####


CALL                                                         COUNT
__fsr                                                            1
main                                                             1
banprt                                                           1
banner                                                           1
banset                                                           1
convert                                                          5
banfil                                                           5
TOTAL:                                                          15

CALL                                                       ELAPSED
banset                                                       38733
banfil                                                      150280
convert                                                     152113
banner                                                      907212
__fsr                                                      1695068
banprt                                                     1887674
TOTAL:                                                     4831080

CALL                                                           CPU
banset                                                        7710
convert                                                       9566
banfil                                                       11931
__fsr                                                        15199
banner                                                       52685
banprt                                                      776429
TOTAL:                                                      873520
dvmstat 该程序为一个特定的 PID、进程名称或运行命令时提供类似 vmstat 的数据。它每秒打印一次统计信息。这里我们监控一个“find”进程,并且可以清楚地看到它耗尽了缓存(丢弃“re”回收),然后推迟到磁盘(增加“maj”主要故障和“fpi”文件系统分页)。完整 的例子。
# dvmstat -n find
    re   maj    mf   fr  epi  epo  api  apo  fpi  fpo     sy
     0     0     0    0    0    0    0    0    0    0      0
     0     0     0    0    0    0    0    0    0    0      0
  6336     0   372    0    0    0    0    0    0    0  22255
  1624     0     0    0    0    0    0    0    0    0   5497
  2292     0     0    0    0    0    0    0    0    0   7715
 13064     0     0    0    0    0    0    0    0    0  43998
  7972   168     0    0    0    0    0    0  168    0  38361
   468   636     0    0    0    0    0    0  636    0  13774
   376   588     0    0    0    0    0    0  588    0  10723
    80   636     0    0    0    0    0    0  656    0  11078
    48   772     0    0    0    0    0    0  812    0   9841
    16  1028     0    0    0    0    0    0 1056    0  10752
     0  1712     0    0    0    0    0    0 1740    0  12176
     4  1224     0    0    0    0    0    0 1236    0   9024
topsyscall 这个程序连续打印一个top系统调用的报告,并且每1秒或者按照指定刷新一次显示。完整 的例子。
2005 Jun 14 02:26:40, load average: 0.16, 0.18, 0.21   syscalls: 1381

   SYSCALL                          COUNT
   waitsys                              5
   getuid                               5
   xstat                                7
   munmap                               7
   brk                                  8
   sysconfig                            8
   open                                 8
   getpid                               9
   close                                9
   resolvepath                         10
   setcontext                          18
   setitimer                           25
   mmap                                26
   lwp_sigmask                         32
   lwp_park                            41
   write                               78
   read                                78
   sigaction                          113
   pollsys                            318
   ioctl                              526
shellsnoop 从系统上运行的 shell 实时捕获文本输入和输出。在这个例子中,shellsnoop 在一个窗口中运行,而在另一个窗口中运行了几个命令:date、cal 和 uname -a。(这就像一个简单版本的 ttywatcher)。完整的例子在 这里。
# shellsnoop
  PID  PPID      CMD DIR  TEXT
 4724  3762      ksh   R
 4724  3762      ksh   W  date

 4741  4724     date   W  Sun Mar 28 23:10:06 EST 2004
 4724  3762      ksh   R
 4724  3762      ksh   W  jupiter:/etc/init.d>
 4724  3762      ksh   R
 4724  3762      ksh   R
 4724  3762      ksh   W  cal

 4742  4724      cal   W     March 2004
 4742  4724      cal   W   S  M Tu  W Th  F  S
 4742  4724      cal   W      1  2  3  4  5  6
 4742  4724      cal   W   7  8  9 10 11 12 13
 4742  4724      cal   W  14 15 16 17 18 19 20
 4742  4724      cal   W  21 22 23 24 25 26 27
 4742  4724      cal   W  28 29 30 31
 4742  4724      cal   W
 4724  3762      ksh   R
 4724  3762      ksh   W  jupiter:/etc/init.d>
 4724  3762      ksh   R
 4724  3762      ksh   R
 4724  3762      ksh   W  uname -a

 4743  4724    uname   W  SunOS jupiter 5.10 s10_51 i86pc i386 i86pc
 4724  3762      ksh   R
- Shellsnoop 具有仅查看特定 PID 和仅查看打印数据的选项 - 这有点令人毛骨悚然。
- 独立的 shellsnoop.d是原始的 DTrace 唯一版本。
kill.d 这个简单的 DTrace 程序监视谁向进程发送信号。在下面的示例中,bash shell 成功向 PID 3117 发送了“kill -2”(SIGINT),但未能向进程 12345 发送“kill -9”(SIGKILL)
# kill.d
 FROM      COMMAND   SIG TO     RESULT
 2344         bash     2 3117   0
 2344         bash     9 12345  -1
^C
errinfo 报告带有完整 errno 详细信息的系统调用失败,以帮助解释发生这些错误的原因。它有两种输出风格:一种用于观察事件的“snoop”风格(默认),一种用于提供摘要的“count”风格(-c)。两者都在下面演示, 完整示例。
# errinfo
            EXEC          SYSCALL  ERR  DESC
gnome-netstatus-            ioctl   12  Not enough core
     mozilla-bin         lwp_park   62  timer expired
            Xorg             read   11  Resource temporarily unavailable
            Xorg          pollsys    4  interrupted system call
     mozilla-bin         lwp_park   62  timer expired
     mozilla-bin         lwp_park   62  timer expired
            Xorg             read   11  Resource temporarily unavailable
^C
# errinfo -c
Sampling... Hit Ctrl-C to end.
^C
            EXEC          SYSCALL  ERR  COUNT  DESC
gnome-netstatus-            ioctl   12      1  Not enough core
     miniserv.pl          waitsys   10      1  No children
gnome-settings-d             read   11      1  Resource temporarily unavailable
        metacity             read   11      1  Resource temporarily unavailable
     gnome-panel             read   11      1  Resource temporarily unavailable
        nautilus             read   11      1  Resource temporarily unavailable
            dsdm             read   11      2  Resource temporarily unavailable
     soffice.bin             read   11      2  Resource temporarily unavailable
         java_vm    lwp_cond_wait   62      4  timer expired
      svc.startd           portfs   62      5  timer expired
            Xorg          pollsys    4     15  interrupted system call
            Xorg             read   11     26  Resource temporarily unavailable
     mozilla-bin         lwp_park   62     58  timer expired
sshkeysnoop.d 捕获来自在同一服务器上运行的 ssh 客户端命令的击键。尽管密码清晰可见,但这并不是 Solaris 10 的安全问题,而是 DTrace 强大功能的展示。 完整的例子。
# sshkeysnoop.d
  UID   PID  PPID  TYPE  TEXT
  100  9651  8600   cmd  ssh -l fred mars

  100  9651  8600   key  f
  100  9651  8600   key  r
  100  9651  8600   key  e
  100  9651  8600   key  d
  100  9651  8600   key  1
  100  9651  8600   key  2
  100  9651  8600   key  3
  100  9651  8600   key
[...]
shortlived.d 这个简单的 DTrace 程序测量短期进程消耗了多少时间。这通常很难使用 prstat 之类的采样工具来发现。在下面的示例中,许多短暂的“expr”命令实际上消耗了大约 45% 的 CPU。完整的例子 在这里。
# shortlived.d
Sampling.. Hit Ctrl-C to stop.
^C
short lived processes:      3.394 secs
total sample duration:      7.543 secs

Total time by process name,
                ls           14 ms
                df           18 ms
              expr         3049 ms

Total time by PPID,
              2765           32 ms
             29752         3049 ms
cputimes 打印内核/空闲/进程消耗的 CPU 时间。默认输出将 cpu 时间细分打印为三类,内核时间、空闲时间和进程消耗的时间;一切都在纳秒内。 完整的例子。
# cputimes 1 3
2005 Apr 27 23:37:58,
          KERNEL         10795499
         PROCESS         20941091
            IDLE        970707443
2005 Apr 27 23:37:59,
          KERNEL          8919418
         PROCESS         77446789
            IDLE        910555040
2005 Apr 27 23:38:00,
          KERNEL          8615123
         PROCESS         78314246
            IDLE        810100417
cpudists 按内核/空闲/进程打印 CPU 时间分布。默认输出按三个类别打印 cpu 时间使用情况,内核时间、空闲时间和进程时间。该值是以纳秒为单位的时间,计数是发生的次数。完整 的例子。
# cpudists 5 1
2005 Apr 28 00:08:42,
          KERNEL
           value  ------------- Distribution ------------- count
            4096 |                                         0
            8192 |@@@@@@@@@@@@@@@@@@@@@@@@@@@@             1134
           16384 |@@@@@@@@@                                344
           32768 |@@@                                      104
           65536 |                                         3
          131072 |                                         0

         PROCESS
           value  ------------- Distribution ------------- count
            8192 |                                         0
           16384 |@@@@@@@@@                                170
           32768 |@@@@@@@@@@@@@@@@@@                       331
           65536 |@@@@@@@@                                 152
          131072 |@                                        17
          262144 |@                                        25
          524288 |@                                        13
         1048576 |                                         4
         2097152 |                                         0

            IDLE
           value  ------------- Distribution ------------- count
         2097152 |                                         0
         4194304 |@                                        9
         8388608 |@@@@@@@@@@@@@@@@@@@@@@@@@@@@@@@@@@@@@    418
        16777216 |@@@                                      31
        33554432 |
```                                        0
setuids.d 监听 setuid 调用。这可用于监视用户登录和“su”使用情况。完整的例子在 这里。
setuids.d
UID SUID PPID PID PCMD CMD
0 100 3037 3040 in.telnetd login -p -h mars -d /dev/pts/12
100 0 3040 3045 bash su -
0 102 3045 3051 sh su - fred
0 100 3055 3059 sshd /usr/lib/ssh/sshd
0 100 3065 3067 in.rlogind login -d /dev/pts/12 -r mars
0 100 3071 3073 in.rlogind login -d /dev/pts/12 -r mars
0 102 3078 3081 in.telnetd login -p -h mars -d /dev/pts/12
[…]
**[bitize.d](https://www.brendangregg.com/DTrace/bitesize.d)** 是一个简单的程序,用于检查进程使用磁盘的方式——它们是导致大型 I/O 操作还是许多小的“咬”?在下面的示例中,我们可以看到 find 命令导致了大部分 1K 事件,而 tar 命令在每个操作中传输了更多数据。完整 [的例子](https://www.brendangregg.com/DTrace/bitesize_example.txt)。
bitesize.d
Sampling… Hit Ctrl-C to end.
^C
 PID  CMD
7109  find /

       value  ------------- Distribution ------------- count
         512 |                                         0
        1024 |@@@@@@@@@@@@@@@@@@@@@@@@@@@@@@@@@@       1452
        2048 |@@                                       91
        4096 |                                         33
        8192 |@@                                       97
       16384 |                                         0

   3  fsflush

       value  ------------- Distribution ------------- count
        4096 |                                         0
        8192 |@@@@@@@@@@@@@@@@@@@@@@@@@@@@@@@@@@@@@@@@ 449
       16384 |                                         0

7108  tar cf /dev/null /

       value  ------------- Distribution ------------- count
         256 |                                         0
         512 |                                         70
        1024 |@@@@@@@@@@                               1306
        2048 |@@@@                                     569
        4096 |@@@@@@@@@                                1286
        8192 |@@@@@@@@@@                               1403
       16384 |@                                        190
       32768 |@@@                                      396
       65536 |                                         0
[…]
**[seeksize.d](https://www.brendangregg.com/DTrace/seeksize.d)** 按进程打印磁盘磁头寻道距离。这可以识别进程是否以“随机”或“顺序”方式访问磁盘。下面的示例说明了顺序访问。将 seeksize.d 与 bitize.d 结合使用。完整 [的例子](https://www.brendangregg.com/DTrace/seeksize_example.txt)。
seeksize.d
Sampling… Hit Ctrl-C to end.
^C
PID CMD
22349 scp /dl/sol-10-b63-x86-v1.iso mars:
       value  ------------- Distribution ------------- count
          -1 |                                         0
           0 |@@@@@@@@@@@@@@@@@@@@@@@@@@@@@@@@@@@@@@   726
           1 |                                         0
           2 |                                         0
           4 |                                         0
           8 |@                                        13
          16 |                                         4
          32 |                                         0
[…]
**[zvmstat](https://www.brendangregg.com/DTrace/zvmstat)** 是 vmstat 的 DTrace 版本,用于打印每个区域的信息。更多例子 [在这里](https://www.brendangregg.com/DTrace/zvmstat_example.txt)。
zvmstat 1
  ZONE   re    mf   fr    sr  epi  epo  epf  api  apo  apf  fpi  fpo  fpf
global   54   316    1     0    0    0    0    0    0    0    0    1    1
workzone1 0 0 0 0 0 0 0 0 0 0 0 0 0
ZONE re mf fr sr epi epo epf api apo apf fpi fpo fpf
global 157 659 1 0 10 0 0 0 0 0 3 2 1
workzone1 770 1085 0 0 48 0 0 0 0 0 928 0 0
ZONE re mf fr sr epi epo epf api apo apf fpi fpo fpf
global 56 317 0 0 6 0 0 0 0 0 2 0 0
workzone1 1478 21 0 0 0 0 0 0 0 0 1635 0 0
[…]
**[zhostid](https://www.brendangregg.com/DTrace/zhostid)** 是一个 DTrace 守护程序,用于将每个区域的主机 ID 更改为不同的值。更多例子 [在这里](https://www.brendangregg.com/DTrace/zhostid_example.txt)。
global# ./zhostid &
[1] 8717
global# hostid
12345678
global#
global# zlogin workzone1
[Connected to zone ‘workzone1’ pts/10]
Last login: Tue Jun 21 03:51:10 on pts/10
Sun Microsystems Inc. SunOS 5.10 Generic January 2005
hostid
90abcdef
socketsnoop.d This program snoops socket data transfer events by process, identifying which process is responsible for reading or writing data on the network. Full example.
socketsnoop.d
UID PID DIR SIZE CMD
0 19886 W 64 ssh mars
0 19886 R 80 ssh mars
0 19915 W 0 finger @mars
0 19915 W 2 finger @mars
0 19915 R 633 finger @mars
0 19915 R 0 finger @mars
0 19886 W 64 ssh mars
0 19886 R 80 ssh mars
0 19886 W 48 ssh mars
0 19886 R 80 ssh mars
100 4789 W 6 vncviewer mars:4
100 4789 R 348 vncviewer mars:4
100 4789 W 10 vncviewer mars:4
[…]
**[anonprofile.d](https://www.brendangregg.com/DTrace/anonprofile.d)** 是一个按进程窥探匿名内存使用情况的程序。这提供了进程的匿名内存大小随时间变化的配置文件。它可以帮助解决软件开发过程中的内存问题。更多例子 [在这里](https://www.brendangregg.com/DTrace/anonprofile_example.txt)。
anonprofile.d
UID PID TOTAL ARGS
0 14380 4169728 /usr/sbin/dtrace -s anonprofile.d
100 14382 4096 bash
100 14382 8192 ls -l
100 14382 12288 ls -l
100 14382 20480 ls -l
100 14382 24576 ls -l
100 14382 28672 ls -l
100 14382 57344 ls -l
100 14382 65536 ls -l
100 14382 73728 ls -l
100 14382 106496 ls -l
100 14382 110592 ls -l
100 14382 118784 ls -l
100 14382 126976 ls -l
100 14382 131072 ls -l
100 14382 135168 ls -l
100 14382 143360 ls -l
[…]
**[intrtime](https://www.brendangregg.com/DTrace/intrtime)** 内核在中断线程中花费的时间以前很难测量。intrtime 给出了中断类型和服务时间的细分。 [完整的例子](https://www.brendangregg.com/DTrace/intrtime_example.txt)。
intrtime 1
Interrupt Time(ns) %Time
uhci_intr 23753 0.00
ata_intr 3698089 0.37
i8042_intr 7360399 0.73
gld_intr 12319508 1.22
TOTAL(int) 23401749 2.31
TOTAL(dur) 1012546207 100.00
**[typewriter-0.75.tar.gz](https://www.brendangregg.com/DTrace/typewriter-0.75.tar.gz)** 这使您的控制台键盘听起来像机械键盘。这仅供娱乐
./ultra5.d &
[1] 7660
typewriter.d running for the console keyboard.
## 故障排除示例
这些是使用 DTrace 执行故障排除的示例,通常在使用 DTrace 脚本(如上述工具)之前先在命令行中使用 DTrace。
**[DTrace 与 truss](https://www.brendangregg.com/DTrace/dtracevstruss.html)** 这展示了使用 DTrace 与 truss 的性能影响。DTrace 旨在最大程度地减少系统运行时的负担。
**[DTracing SMC](https://www.brendangregg.com/DTrace/smc.html)** 在这里,我们快速了解使用 DTrace 来调查 SMC 首次执行时的行为。SMC 是一个系统管理 GUI,它在编译 Java 类时第一次运行需要一段时间。
**[DTracing Lost CPU](https://www.brendangregg.com/DTrace/lostcpu.html)** 在这里,我们来看看一个神秘的问题,即 CPU 很忙,但似乎没有任何进程对此负责。CPU时间去哪儿了?
**[prstat vs top](https://www.brendangregg.com/DTrace/prstatvstop.html)** 这分析了运行 prstat 与运行 top 的 CPU 开销。过去有人认为 top 是 CPU 占用量大 - DTrace 可以测量它。
## DTraceTazTool
几年前, [Richard McDougall](http://blogs.sun.com/roller/page/rmc)编写了 [taztool](http://www.solarisinternals.com/si/tools/taz/index.php) - 一个以惊人而直观的方式显示磁盘活动的 GUI。[它使用 TNF 跟踪数据 - DTrace](http://www.opensolaris.org/os/community/dtrace)的前身 。DTraceTazTool 是 taztool 的 DTrace 版本。它目前正在开发中,因此这是一个 alpha 版本。还有更多功能需要编码,但它可能已经证明是一个有用的工具。
DTraceTazTool 的当前版本是: [DTaz-0.51](https://www.brendangregg.com/DTaz/DTaz-0.51.tar.gz)。
下图显示了 DTraceTazTool 在 UFS 文件系统通过 tar 命令归档时跟踪它的活动。对于顶部图:请求的块位置在 Y 轴上,时间在 X 轴上,颜色反映了对该位置的请求数(很多 == 红色)。底部图显示最大和平均寻道距离,
粗红线表示连续磁盘活动,分散的蓝色块表示随机磁盘活动。
DTraceTazTool 已经有一些可调选项,例如绘制的像素大小和采样率,
DTraceTazTool 需要以 root 身份运行,或者以具有 dtrace_kernel 权限的用户身份运行。
## 探索者
**[dexplorer](https://www.brendangregg.com/DTrace/dexplorer)** DExplorer 自动运行一组 DTrace 脚本来检查系统的许多区域,并将输出放在一个有意义的目录结构中,即 tar'd 和 gzip'd。以下是 0.70 版本的示例。完整 [的例子](https://www.brendangregg.com/DTrace/dexplorer_example.txt)。
dexplorer
Output dir will be the current dir (/export/home/root/DTrace/Dexplorer).
Hit enter for yes, or type path:
Starting dexplorer ver 0.70.
Sample interval is 5 seconds. Total run is > 100 seconds.
0% Interrupts by CPU…
5% Interrupt counts…
10% Dispatcher queue length by CPU…
15% Sdt counts…
20% Pages paged in by process name…
25% Files opened count…
30% Disk I/O size distribution by process name…
35% Minor faults by process name…
40% Vminfo data by process name…
45% Mib data by mib statistic…
50% TCP write bytes by process…
55% Sample process @ 1000 Hz…
60% Syscall count by process name…
65% Syscall count by syscall…
70% Read bytes by process name…
75% Write bytes by process name…
80% Sysinfo counts by process name…
85% New process counts with arguments…
90% Signal counts…
95% Syscall error counts…
100% Done.
File is de_jupiter_200506271803.tar.gz
ls -l de_jupiter_200506271803.tar.gz
-rw-r–r-- 1 root root 6346 Jun 27 18:05 de_jupiter_200506271803.tar.gz
输出文件可用于发送给其他人进行分析。